| CPC H04L 43/045 (2013.01) [H04L 43/08 (2013.01); H04L 43/106 (2013.01)] | 20 Claims |

|
1. A computer-implemented method, comprising:
obtaining, from a data store of a data intake and query system, timestamped event data indicating instances of network activity involving a plurality of networked computing devices, wherein each of the instances of network activity is identified by: a source device's network address, a destination device's network address, and a timestamp associated with the instance of network activity; and
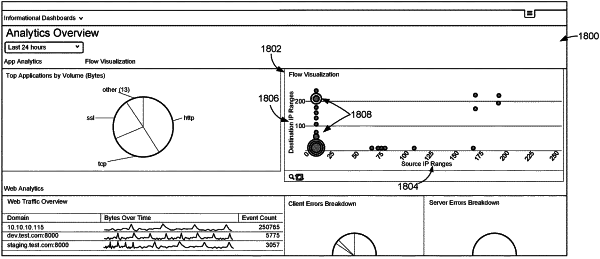
causing display of an interface including a visualization of the instances of network activity, wherein the visualization includes:
a first axis and a second axis each representing an entire range of network addresses of an Internet Protocol (IP) network address space, and
an animated series of data points, wherein each data point of the animated series of data points is displayed in a chronological order based on the timestamps associated with the instances of network activity.
|