| CPC G06V 20/698 (2022.01) [G01N 1/30 (2013.01); G06T 7/0012 (2013.01); G06V 20/69 (2022.01); G06V 20/695 (2022.01); G06F 3/04847 (2013.01); G06T 2207/10056 (2013.01); G06T 2207/10064 (2013.01); G06T 2207/30024 (2013.01)] | 27 Claims |

|
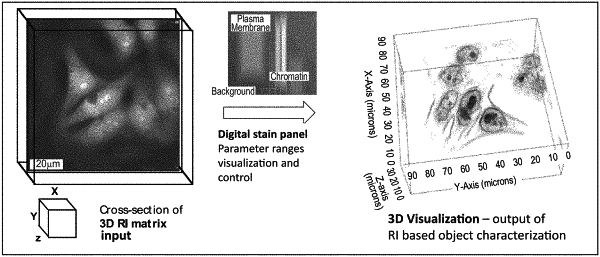
1. A method of digital characterization of a microscopic object based on measured refractive index data representing at least a spatial distribution of measured values of refractive index (RI) or values correlated to refractive index of said microscopic object, the method comprising: inputting in a computing system said measured refractive index data; executing an algorithm applying a plurality of transformations on said refractive index data to generate a spatial distribution of a plurality of parameters; the method further comprising associating a label characterizing a feature of the microscopic object to a defined range of values of said plurality of parameters, whereby different features of the microscopic object are characterized by different defined ranges of values of the plurality of parameters and associated to different labels, further comprising associating a stain colour to at least one said label and generating an image file for display of at least one said feature on a screen for a user to visualize, wherein the microscopic object is biological matter,
wherein the segmentation includes a feedback loop for adjusting values of said feature dataset based on external or user based input,
wherein said feedback includes external inputs, said external inputs including any one or more of previously acquired data characterizing microscopic objects, data on reference objects, data from machine learning programs, data characterizing the microscope by which the microscopic object is measured, shape recognitions programs, or correlation functions of said external data with the microscopic object.
|