| CPC G06T 11/206 (2013.01) [G06Q 10/0637 (2013.01); G06Q 40/06 (2013.01); G06T 11/60 (2013.01); G06F 3/04842 (2013.01); G06T 2200/24 (2013.01)] | 20 Claims |

|
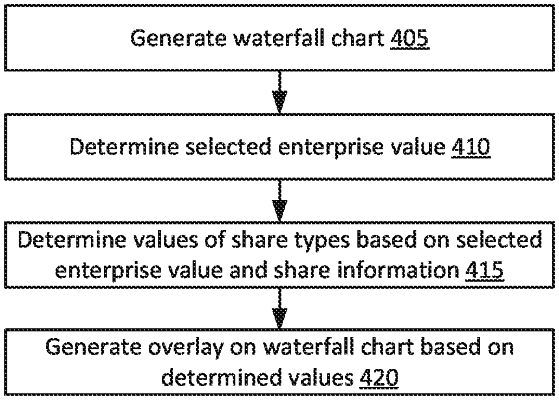
1. A computer-readable storage medium, excluding transitory signals and carrying instructions, which, when executed by at least one data processor of a system, cause the system to:
generate a graphical chart representing a price per share relative to a range of values for different types of shares of an enterprise;
determine a first value for the enterprise based on a first position of an indicator on the graphical chart,
wherein the first position is determined based on user input;
determine a first set of values for the different types of shares based on the first value;
cause display of a graphic overlay including content indicative of the first set of values for the different types of shares,
wherein the content of the graphic overlay is based on the first position of the indicator;
determine a second value for the enterprise based on a second position of the indicator on the graphical chart,
wherein the second position is different from the first position; and
dynamically update the content of the graphic overlay based on the second position of the indicator on the graphical chart,
wherein the updated content is indicative of a second set of values for the different types of shares.
|