| CPC G06T 7/0016 (2013.01) [C07K 16/2818 (2013.01); G16H 10/40 (2018.01); G16H 20/10 (2018.01); G16H 30/20 (2018.01); G16H 30/40 (2018.01); G16H 50/20 (2018.01); G16H 50/50 (2018.01); G16H 50/70 (2018.01); C07K 2317/24 (2013.01); G06T 2207/10056 (2013.01); G06T 2207/30024 (2013.01); G06T 2207/30096 (2013.01)] | 43 Claims |

|
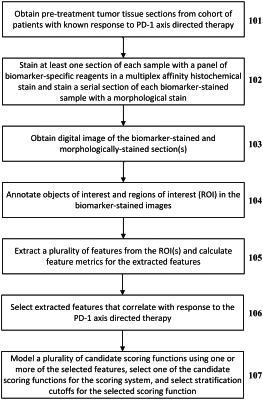
1. A method of scoring a tumor sample for likelihood of responding to a PD-1 axis directed therapy, the method comprising:
(a) obtaining a digital image of a tumor section from the tumor sample, wherein the tumor section is stained in a multiplex affinity histochemical stain for each of PD-L1, CD8, CD3, CD68, and an epithelial marker (EM−);
(b) extracting a feature metric from a region of interest (ROI) in the image, the feature metric selected from the group consisting of:
(i) mean distance between CD8+ cells in the ROI and closest PD-L1+/CD68+ cell,
(ii) mean distance between CD8+ cells in the ROI and closest PD-L1+/CD3+ cells,
(iii) mean distance between epithelial cells in the ROI and closest CD8+ cell,
(iv) number of PD-L1+ epithelial cells in the ROI within 10 μm of a CD8+ cell,
(v) number of PD-L1+ epithelial cells in the ROI within 30 μm of a CD8+ cell
(vi) number of CD8+ cells in the ROI within 10 μm of an epithelial cell
(vii) number of CD8+ cells in the ROI within 30 μm of an epithelial cell
(viii) density of PD-L1+/CD3+ cells in the ROI
(ix) density of PD-L1+/CD3+/CD8− cells in the ROI
(x) density of PD-L1+/CD8+ cells in the ROI
(xi) density of PD-L1+/CD68+ cells in the ROI
(xii) density of PD-L1+ epithelial cells in the ROI
(xiii) density of CD3+ cells in the ROI
(xiv) density of CD8+ cells in the ROI
(xv) density of CD68+ cells in the ROI
(xvi) density of epithelial cells in the ROI
(xvii) ratio between area occupied by PD-L1+ epithelial cells in the ROI and the total area of the ROI
(xviii) ratio between area occupied by epithelial cells in the ROI and the total area of the ROI
(xix) ratio between number of PD-L1+ epithelial cells in the ROI and the total number of epithelial cells in the ROI
(xx) ratio between number of PD-L1+/CD3+ cells in the ROI and the total number of CD3+ cells in the ROI
(xxi) ratio between number of PD-L1+/CD3+/CD8− cells in the ROI and the total number of CD3+/CD8− cells in the ROI
(xxii) ratio between number of PD-L1+/CD8+ cells in the ROI and the total number of CD8+ cells in the ROI
(xxiii) ratio between number of PD-L1+/CD68+ cells in the ROI and the total number of CD68+ cells in the ROI
(xxiv) ratio between number of PD-L1+/CD3+/CD8− cells in the ROI and the total number of CD3+/CD8− cells in the ROI,
(xxv) ratio between number of CD3+/CD8− cells in the ROI and the total number of CD3+ cells in the ROI,
(xxvi) total area occupied by CD3+ cells; and
(c) applying a scoring function to a feature vector comprising the feature metric to generate a score indicative of the likelihood that the tumor will respond to the PD-1 axis directed therapy.
|