| CPC G06F 3/0481 (2013.01) [G06F 3/04842 (2013.01); G06F 3/04847 (2013.01); G06F 3/0485 (2013.01); G06T 11/206 (2013.01); G06T 2200/24 (2013.01)] | 16 Claims |

|
1. A computer-implemented method executed by data processing hardware that causes the data processing hardware to perform operations comprising:
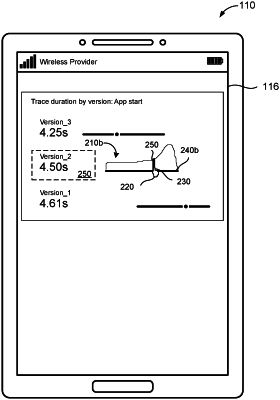
displaying, via a graphical user interface (GUI), a first graphical representation of a dataset on a display screen in communication with the data processing hardware, the first graphical representation representing a statistical summary of the dataset, the first graphical representation is a box-and-whiskers plot of the dataset;
receiving, via the GUI, an indication of a user interaction on the first graphical representation; and
in response to the received indication of the user interaction, displaying, via the GUI, a second graphical representation of the dataset on the display screen, the second graphical representation representing a plurality of statistical summaries of the dataset, the second graphical representation comprising a second graph of the dataset, the second graph extends from a single time axis that the second graph shares with the box-and-whiskers plot, wherein each respective statistical summary of the plurality of statistical summaries computed for a respective time period of a plurality of time periods.
|