| CPC G06F 16/29 (2019.01) [G06F 16/242 (2019.01); G06F 16/2455 (2019.01); G06F 16/3323 (2019.01)] | 20 Claims |

|
1. A method performed by a system to generate a query visualization, wherein the method comprises:
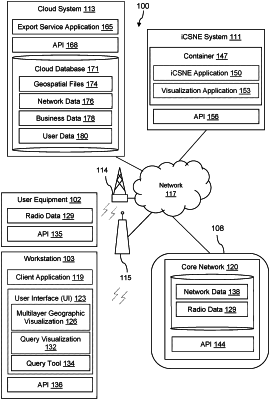
transmitting, by a client application at a workstation, a request comprising parameters and location information describing a geographic boundary to an export service application positioned at a cloud system and coupled to a geospatial database;
communicating, by the export service application, with the geospatial database, to convert the parameters received in the request to query parameters that are formatted to be compatible with the geospatial database;
generating, by the export service application, a database query comprising the query parameters;
transmitting, by the export service application, the database query to the geospatial database to execute the database query at the geospatial database;
receiving, by the export service application, a result of the database query from the geospatial database, wherein the result of the database query comprises data from one or more of files stored at the geospatial database, and wherein the query visualization is generated based on the result of the database query and presented at the workstation; and
presenting, by the client application at the workstation, the query visualization indicating various types of data, wherein the query visualization provides a visual indication of the data queried by a user within the geographic boundary.
|