| CPC G06Q 10/0635 (2013.01) | 24 Claims |

|
1. A computer implemented system comprising a processer configured to provide a visual interactive software tool that permits users to investigate and evaluate financial, trade, and business-related risks, comprising:
a computer system configured to include:
a database, stored in nonvolatile memory and configured to store graph data structures comprising a plurality of different types of nodes, edges, and related properties that are used by the system to build a graph, wherein the database stores information represented as nodes, edges, and related properties, wherein the related properties assigned to nodes are configured to include one or more risk categories and wherein the database is configured to allow one or more of the nodes to be designated to be seeds, wherein each seed is associated with one of the risk categories;
a risk propagation engine that is configured to apply a process to the graph that assigns one of a plurality of the risk categories and a corresponding value for the assigned risk category to a plurality of nodes, wherein the process comprises one or more defined risk propagation rules configured to adapt the graph to dynamically propagate and modify the corresponding values for the assigned risk categories, wherein the one or more defined risk propagation rules are configured, starting from individual seeds, to traverse through the graph following one or more paths comprising connected nodes and edges, and determine an exposure score for the risk category at a node in the traversed path as a function of the value of the risk assigned to the starting seed and, in at least one or more paths comprising one or more risk categories, also as a function of one or more interrelationships between two or more risk categories;
a visual interactive graphical interface that is configured to
display a visual workspace onto which the user can select to add one or more nodes, subgraphs, or connections,
display an option for the user to select one or more risk categories in association with the visual workspace,
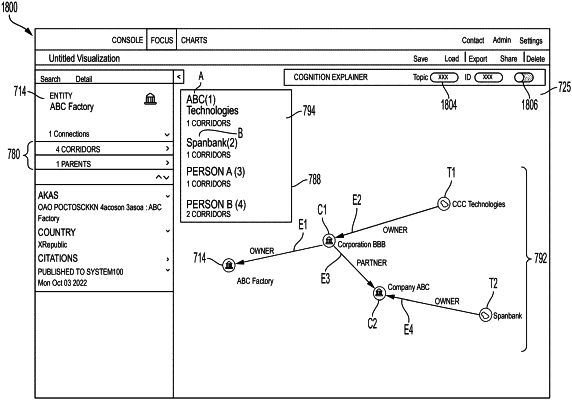
responsive to the process and in response to a user selecting a node to add to the visual workspace and selecting one or more of the risk categories, display a subgraph, determined by the process, illustrating one or more paths of the selected risk category from one or more of the seeds, through nodes and edges and ending at the selected node, wherein in at least one or more displayed subgraphs, one or more nodes in the displayed subgraph have assigned related properties that include more than one risk category, and
display the exposure score for the risk category for the selected node, and
wherein the system is configured to add or receive new nodes or updates to the graph database and automatically applies the rule propagation engine to adjust values for risk for the risk category determined at the nodes.
|