| CPC G06F 21/6254 (2013.01) [G06F 3/0482 (2013.01); G06F 16/5866 (2019.01); G16H 30/20 (2018.01); H04L 63/20 (2013.01)] | 22 Claims |

|
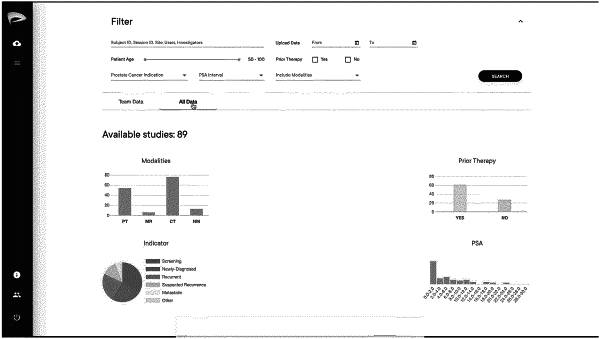
1. A method for interactive display of data representing a plurality of medical imaging studies uploaded to a network-based analysis or decision support platform via a graphical user interface (GUI), the method comprising:
(a) accessing, by a processor of a computing device, a data table comprising, for each of a plurality of study summary variables, a set of values of the study summary variable, each value of the set associated with a particular medical imaging study previously uploaded to the network-based platform, wherein the study summary variables comprise a prostate cancer indication representing one of a set of indications for categorizing a patient or their prostate cancer status;
(b) causing, by the processor, display of a graphical user interface (GUI) comprising:
(i) a plurality of graphical filter control elements, each graphical filter control element corresponding to a particular study summary variable and providing for a user selection of a sub-range of values of the particular study summary variable; and
(ii) a plurality of graphical data representations, each graphical data representation corresponding to a study summary variable and providing a visual representation of distribution of the set of values of the study summary variable in the data table, wherein at least one of the plurality of graphical data representations corresponds to the prostate cancer indication and provides a visual representation of a distribution of values for the set of indications associated with and across the plurality of medical imaging studies;
(c) receiving, by the processor, via a particular graphical filter control element, a user selection of a sub-range for values of the corresponding particular study summary variable, and using the selected sub-range as a filter to identify, within the data table, for each specific study summary variable, a filtered sub-set of values of the specific study summary variable comprising only those values that are associated with uploaded medical imaging studies which are themselves also associated with those values of the particular study summary variable falling within the selected sub-range; and
(d) causing, by the processor, graphical rendering of an updated version of the each of the graphical data representations, each providing a visual representation of distribution of values in the filtered sub-set of the corresponding study summary variable.
|