| CPC G06F 30/20 (2020.01) [G06F 16/9024 (2019.01); G06F 30/12 (2020.01)] | 30 Claims |

|
1. A computer-program product tangibly embodied in a non-transitory machine-readable storage medium, the computer-program product including instructions implementing a computer profiler tool of a computing system to cause the computing system to:
generate, by the computer profiler tool, an interactive adjustable power analysis graphically indicating a relationship between one or more adjustable settings and each of a plurality of power profiles, wherein to generate the interactive adjustable power analysis, the instructions are operable to cause the computer profiler tool to:
obtain, for a design of an experiment, settings comprising:
a first sample size indicating an amount of members for a first group observed as part of the experiment;
a design quality metric that assesses, based on the first sample size, a quality of the design for the experiment prior to conducting the experiment; and
a parameter pertaining to the first group;
generate a graphical user interface by:
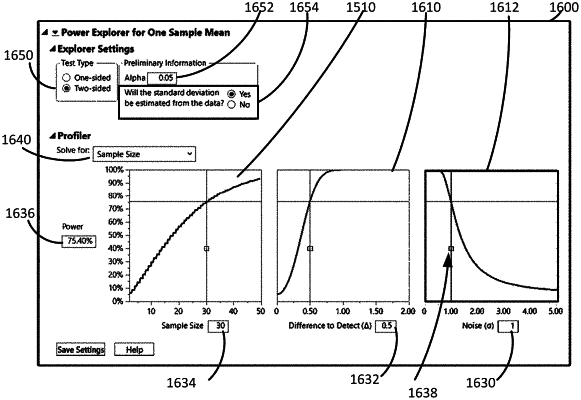
generating a first interactive graph visually representing the design quality metric as a function of the first sample size, wherein a first setting comprises a value on an x-axis of the first interactive graph; and
generating a second interactive graph visually representing the design quality metric as a function of the parameter pertaining to the first group, wherein a second setting comprises a value on an x-axis of the second interactive graph and is different from the first setting; and
display the first and second interactive graphs to a user in a graphical user interface;
update, by the computer profiler tool, the interactive adjustable power analysis, wherein to update the interactive adjustable power analysis, the instructions are operable to cause the computer profiler tool to:
receive, using the graphical user interface, a first user indication modifying at least one of the first and second settings;
update, in the graphical user interface:
the first interactive graph according to the modified at least one of the first and second settings, wherein updating the first interactive graph modifies the relationship between the modified at least one of the first and second settings and the design quality metric as a function of the first sample size; and
the second interactive graph according to the modified at least one of the first and second settings, wherein updating the second interactive graph modifies the relationship that exists between the modified at least one of the first and second settings and the design quality metric as a function of the parameter pertaining to the first group; and
output both the updated first and second interactive graphs to the graphical user interface.
|