| CPC H04N 25/134 (2023.01) [A61B 5/0071 (2013.01)] | 10 Claims |

|
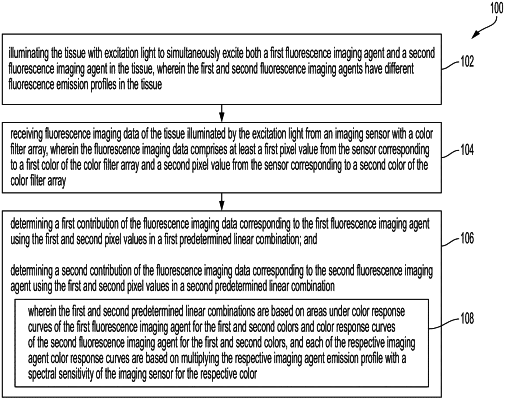
1. A method of distinguishing between fluorescence imaging data contributions corresponding to a first fluorescence imaging agent and a second fluorescence imaging agent in a tissue of a patient during surgical imaging, comprising:
illuminating the tissue with excitation light to simultaneously excite both the first fluorescence imaging agent and the second fluorescence imaging agent in the tissue, wherein the first and second fluorescence imaging agents have different fluorescence emission profiles in the tissue;
receiving fluorescence imaging data of the tissue illuminated by the excitation light from an imaging sensor with a color filter array, wherein the fluorescence imaging data comprises at least a first pixel value from the imaging sensor corresponding to a first color of the color filter array and a second pixel value from the imaging sensor corresponding to a second color of the color filter array;
determining color response curves of the first fluorescence imaging agent for the first and second colors and color response curves of the second fluorescence imaging agent for the first and second colors based on multiplying the respective fluorescence imaging agent emission profile with a spectral sensitivity of the imaging sensor for each respective color;
determining areas under the color response curves of the first fluorescence imaging agent for the first and second colors and the color response curves of the second fluorescence imaging agent for the first and second colors;
determining a first contribution to the fluorescence imaging data corresponding to the first fluorescence imaging agent using the first and second pixel values in a first predetermined linear combination; and
determining a second contribution to the fluorescence imaging data corresponding to the second fluorescence imaging agent using the first and second pixel values in a second predetermined linear combination,
wherein the first and second predetermined linear combinations are based on the areas under the color response curves.
|