| CPC H01J 49/0009 (2013.01) [H01J 49/0031 (2013.01); H01J 49/0036 (2013.01)] | 5 Claims |

|
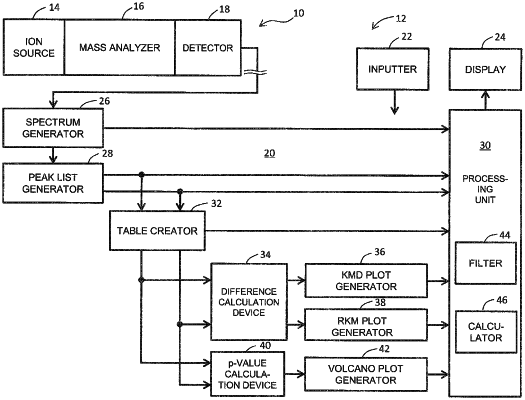
1. A mass spectrum processing apparatus comprising a processor configured to:
generate a first mass spectrum based on a first detection signal acquired by a mass analysis of a first polymer sample generated by a first synthesis method and a second mass spectrum based on a second detection signal acquired by a mass analysis of a second polymer sample generated by a second synthesis method;
generate a first peak list from the first mass spectrum and a second peak list from the second mass spectrum;
calculate a numerical value array representing a difference between the first peak list and the second peak list based on the first peak list and the second peak list;
calculate, for each numerical value of the numerical value array, an integer mass from a mass of a molecule as a whole and a fractional mass from a mass of a portion in a molecule other than a primary chain, based on the numerical value array, thereby calculating integer masses and fractional masses;
generate a difference plot by placing a group of elements corresponding to the numerical value array with respect to a coordinate system defined by a horizontal axis representing the integer mass, and a vertical axis representing the fractional mass, based on the integer masses and the fractional masses;
wherein the numerical value array is generated by calculating differential values or ratios between the first peak list and the second peak list so as to identify a difference between the first polymer sample and the second polymer sample to be compared,
wherein the integer mass is a nominal Kendrick mass, the fractional mass is a Kendrick mass defect, each element in the group is a figure, wherein a color of the figure represents a sign of a numerical value corresponding to that element and a size of the figure represents a magnitude of the numerical value corresponding to that element; and
change, for each numerical value in the numerical value array, the color and the size of the figure according to each numerical value in the numerical value array,
wherein the first polymer sample includes a plurality of first polymers, the second polymer sample includes a plurality of second polymers, the group of elements in the difference plot includes a plurality of element arrays which are parallel to the horizontal axis, the plurality of element arrays represents differences between the plurality of first polymers and the plurality of second polymers, and
the differences are caused by a difference between the first synthesis method and the second synthesis method, wherein either the first synthesis method or the second synthesis method is determined as a preferred synthesis method based on the plurality of element arrays,
when a particular element array is designated from the plurality of element arrays so as to identify in detail one of the differences caused by the difference between the first synthesis method and the second synthesis method, the processor is configured to:
extract a first particular peak array from the first mass spectrum for the first polymer sample and a second particular peak array from the second mass spectrum for the second polymer sample based on the particular element array, the first particular peak array corresponding to a first particular polymer in the first polymers generated by the first synthesis method, and the second particular peak array corresponding to a second particular polymer in the second polymers generated by the second synthesis method;
calculate an first evaluation value based on the first particular peak array and a second evaluation value based on the second particular peak array, the first evaluation value including at least one of a total ion intensity, an average molecular weight and a polydispersity of the first particular polymer, and the second evaluation value including at least one of a total ion intensity, an average molecular weight and a polydispersity of the second particular polymer; and
compare the first evaluation value and the second evaluation value so as to identify a difference between the first particular polymer generated by the first synthesis method and the second particular polymer generated by the second synthesis method.
|