| CPC G06F 40/18 (2020.01) [G06F 40/106 (2020.01); G06F 40/169 (2020.01); G06F 40/197 (2020.01)] | 25 Claims |

|
1. A system for graphically summarizing percentage make-up of non-numerical category indicators in columns of a table, the system comprising:
at least one processor configured to:
maintain a table with rows and columns defining cells containing the category indicators, the category indicators classifying information within categories and each category indicator representing a status value;
generate a grouping of cells by identifying from the cells, the rows, and the columns, category indicators in the columns of the table sharing a common characteristic including at least a common status value;
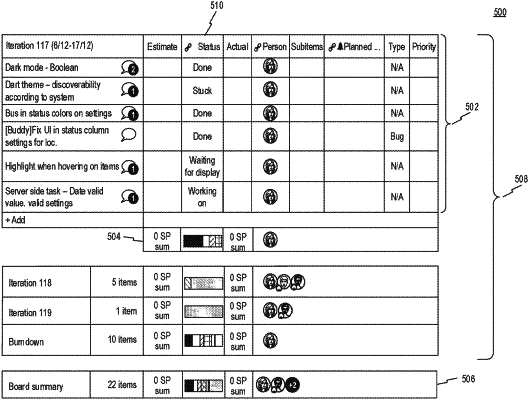
cause a display of a table gauge, including a visual display of summarized information, the visual display having a plurality of graphical representations of a plurality of category indicators contained in the grouping of cells, wherein each category indicator is proportionally presented by a graphical representation in the table gauge that displays a percentage-based distribution of each of the plurality of category indicators in the grouping of cells;
receive a table update that alters at least one category indicator in at least one of the cells of the grouping of cells, wherein the table update is a change of the status value associated with at least one category indicator;
in response to the table update, alter a graphical representation of the table gauge to change a size of at least one of the plurality of graphical representations corresponding to the at least one altered category indicator, wherein the change of the size of the least one graphical representation causes the distribution to re-divide proportionally based on corresponding percentages.
|