| CPC G06F 16/26 (2019.01) [G06F 9/45558 (2013.01); G06F 16/212 (2019.01); G06F 16/258 (2019.01); G06F 16/9024 (2019.01); G06T 11/206 (2013.01); G06F 2009/45579 (2013.01); G06F 2009/45591 (2013.01)] | 20 Claims |

|
1. A method of using a virtual machine for interactive visual analysis, comprising:
at a computer having one or more processors and memory storing one or more programs configured for execution by the one or more processors:
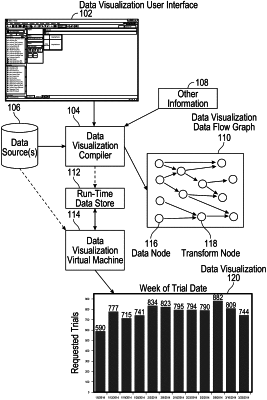
receiving a data visualization data flow graph comprising a directed graph having a plurality of nodes, wherein each of the plurality of nodes specifies either a data retrieval operation or a data transformation operation; and
executing the data flow graph according to directions of arcs between nodes in the data flow graph, thereby retrieving data corresponding to each node that specifies data retrieval and executing the respective transformation operator specified for each of the nodes that specifies a data transformation operation, including performing one or more runtime optimizations for reducing runtime execution time;
thereby generating a data visualization according to one or more nodes of the data flow graph that specify graphical rendering of data visualization elements.
|