| CPC G06T 11/206 (2013.01) [G06F 3/0481 (2013.01); G06F 3/0484 (2013.01); G06F 11/3438 (2013.01); G06Q 10/06398 (2013.01); G06Q 30/018 (2013.01); G09B 19/0053 (2013.01)] | 20 Claims |

|
1. A computer-implemented method, comprising:
receiving command usage data indicating how much a first user entity and a second user entity has used a plurality of commands of a software application;
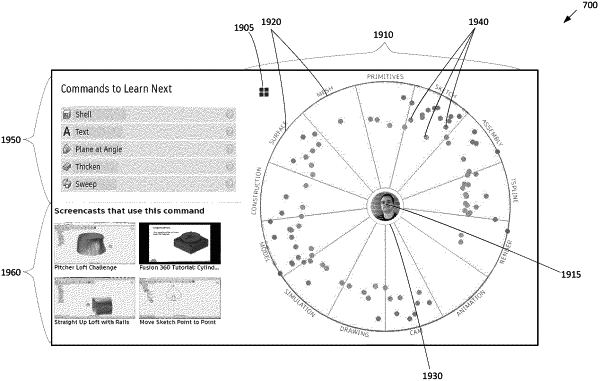
displaying a command map graphical user interface (GUI) comprising a circle chart having a center; and
in response to receiving a selection of the second user entity via the command map GUI, automatically displaying a plurality of data points in the command map GUI associated with the first user entity while not displaying any data points in the command map GUI associated with the second user entity by performing a set of steps of:
displaying a first data point on the circle chart at a first distance from the center of the circle chart to represent how much the first user entity has used the first command, wherein the first data point is displayed with a particular appearance that indicates whether the first user entity has used the first command by a greater amount or lesser amount than the second user entity;
displaying a second data point on the circle chart at a second distance to represent how much the first user entity has used a second command included in the plurality of commands, wherein the second data point is displayed with a particular appearance that indicates whether the first user entity has used the second command by a greater amount or lesser amount than the second user entity, wherein the first data point and the second data point are displayed at least partially concurrently on the circle chart;
determining, based on the command usage data, a third command included in the plurality of commands that has not been used by the first user entity;
determining a recommendation value of the third command for the first user entity based on how much the second user entity has used the third command; and
displaying a third data point on the circle chart at a third distance to represent the recommendation value of the third command for the first user entity.
|