| CPC G06N 20/00 (2019.01) [G06F 18/2113 (2023.01); G06F 18/2413 (2023.01); G06F 18/2431 (2023.01); G06F 18/29 (2023.01)] | 15 Claims |

|
1. A computer-implemented method comprising:
inputting a data item for processing by a machine-learned classifier model;
receiving, in response to inputting the data item, a plurality of confidence scores for a plurality of respective classes, the plurality of confidence scores having been generated by the machine-learned classifier model based on the data item;
determining a distance in dependence on a highest confidence score that is generated for the data item;
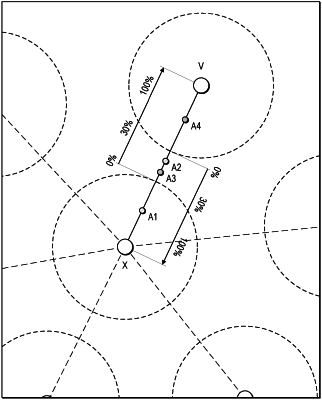
causing display of a class distribution diagram, wherein the class distribution diagram comprises:
a graphical representation corresponding to a first class, said first class being one of said plurality of classes;
a graphical representation corresponding to a second class, said second class being another of said plurality of classes; and
a graphical representation corresponding to the data item, wherein the graphical representation corresponding to the data item is located at said distance between the graphical representation of the first class and the graphical representation of the second class.
|