| CPC G06F 16/215 (2019.01) [G06F 16/2246 (2019.01)] | 7 Claims |

|
1. A method for detecting and correcting abnormal scoring of peer reviews, comprising:
step (1): acquiring scoring data: collecting peer review data sets from an enterprise personnel performance appraisal database to obtain the scoring data, and performing structural transformation on original data information of the scoring data to obtain structured scoring data;
step (2): cleaning the scoring data: cleaning the structured scoring data obtained in the step (1) with a data cleaning method, wherein a data cleaning process comprises data missing value filling and data normalization processing;
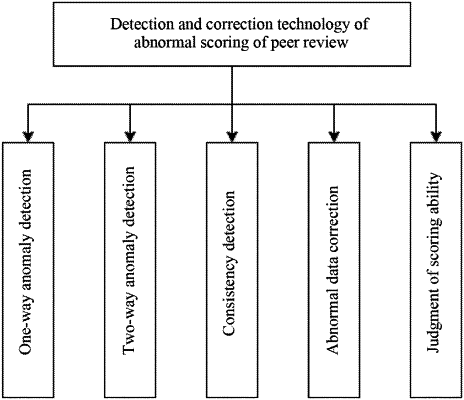
step (3): one-way anomaly detection: performing one-way anomaly detection on each column of one-way scoring results in the structured scoring data, and adding detected abnormal data objects into a first abnormal data set;
wherein the step (3) comprises:
sub-step (3.1): constructing an index structure according to a data set of the structured scoring data, wherein the index structure is a Kd-tree;
sub-step (3.2): outlier mining: establishing a query path, and determining whether to backtrack a current node by calculating a distance between a query node and a current nearest node; if the distance is less than or equal to a set distance threshold D, backtracking the current node until the distance between a backtrack node and the query node is greater than the set distance threshold D; determining outliers, counting a number ml of data objects contained in a D-neighborhood of current query node, and determining the current query node as an outlier if the number ml of data objects contained in the D-neighborhood is less than a threshold M; wherein the threshold M is a maximum number of data objects allowed to be contained in the D-neighborhood of the outlier; and
sub-step (3.3): repeating the sub-step (3.2) to sequentially complete the one-way anomaly detection of each data object in each column in the structured scoring data, and adding the detected abnormal data objects into the first abnormal data set;
step (4): consistency detection: performing consistency detection using a dispersion rate, and adding the detected abnormal data objects into a second abnormal data set; wherein the dispersion rate represents a deviation between scores of a reviewer for different review objects and an average score of various review objects, and a calculation formula of the dispersion rate satisfies:
 where ci represents the dispersion rate of a reviewer i; xij′ represents a degree of difference of the reviewer i on a reviewee j; xij′=xij−xj(mid), xi′ represents the average score of xij′; xi′=1/m−1Σi=1m-1xij′; m represents a number of people participating in the review;
step (5): two-way anomaly detection: performing two-way anomaly detection on the structured scoring data, and adding the detected abnormal data objects into a third abnormal data set; wherein the step (5) comprises:
sub-step (5.1): extracting feature values from a data set of the structured scoring data and generating a structured matrix; wherein the feature values comprise a correlation coefficient, a difference consistency and the dispersion rate; each row in the structured matrix represents a sample, and each column represents a feature value variable;
sub-step (5.2): calculating a covariance matrix of feature variables according to the structured matrix to detect a correlation of the feature values, and if the correlation is greater than a correlation threshold, removing an influence of the correlation between the feature variables with a principal component analysis method; and
sub-step (5.3): clustering by using the feature values and calculating an average value of achievable density ratios of different data objects to nearest neighbors of the different data objects to determine an anomaly degree of the different data objects, and adding abnormal data objects into the third abnormal data set;
step (6): abnormal data set repair: performing abnormal data repair for the first abnormal data set, the second abnormal data set and the third abnormal data set; and
step (7): generating an evaluation report: the evaluation report comprises a reviewer ability evaluation report and an abnormal scoring correction report.
|