| CPC G06V 10/44 (2022.01) [G01W 1/00 (2013.01); G06T 3/4007 (2013.01); G06T 5/30 (2013.01); G06V 10/462 (2022.01)] | 6 Claims |

|
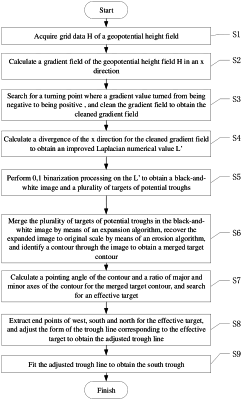
1. A method for automatically identifying south troughs by Laplace operation, comprising the following steps:
S1: acquiring grid data H of a geopotential height field, wherein H [i, j] represents an element in the ith row and jth column in the grid data, H [i, j+1] represents a grid point on a right side of the H [i, j], Δx represents a distance between the two points: H [i, j] and H [i, j+1]; H [i, j+1] represents a grid point on a lower side of the H [i, j], and Δy represents a distance between the two points: H [i, j] and H [i+1, j];
S2: calculating a gradient field of the grid data H of the geopotential height field in a transverse direction (x direction), specifically comprising:
according to the formula,
 acquiring the gradient field Gx in the x direction, wherein ΔH represents an altitude difference of the geopotential height field at the ith row and jth column, Δx represents the distance between the two points in the x direction; and Gx[i, j] represents a gradient value in the x direction in the ith row and jth column in the grid data;
S3: searching for a turning point where a gradient value turned from being negative to being positive, and cleaning the gradient field to obtain a cleaned gradient field, specifically comprising:
S3-1: determining the turning point where the gradient value turned from being negative to being positive according to the gradient field; and
S3-2: reserving data of Gx<0 for the point on the left side of the positive and negative turning point of the gradient value; assigning the gradient value of 0 to rest points; and obtaining the cleaned gradient field G′x, with the expression as follows:
 S4: calculating a divergence of the x direction for the cleaned gradient field to obtain an Laplacian numerical value L′, specifically comprising: according to the formula,
 obtaining the Laplacian numerical value L′, wherein G′ [i, j+1] represents grid data of point on the right side of G′x[i, j] in the cleaned gradient field;
S5: performing 0,1 binarization processing on the L′ to obtain a black-and-white image and a plurality of targets of potential troughs;
S6: merging the plurality of targets of a potential trough line in the black-and-white image by means of an expansion algorithm, thus yielding an expanded image, recovering the expanded image to original scale by means of an erosion algorithm, and identifying a contour through the expanded image after the erosion algorithm to obtain a merged target contour;
S7: calculating a pointing angle of the contour and a ratio of major and minor axes of the contour for the merged target contour, and searching for an effective target;
S8: extracting endpoints of east, west, south and north for the effective target, and adjusting a form of the effective trough line corresponding to the effective target to obtain an adjusted trough line; and
S9: fitting the adjusted trough line to obtain a south trough, and applying the south trough to analyze and forecast weather of south China with improved efficiency and normalization for identifying the south trough, thus reducing working strength of forecasting staffs and timely making accurate judgment on weather situation, and making a contribution to automation of analyzing and forecasting businesses, wherein a current of west wind passing through Qinghai-Tibet Plateau is divided into south and north currents, and a south current is called as the south trough with geographic position between latitude 10-30° N and longitude 75-95° E; and the south trough emerges in a middle dekad (ten-day) of October and disappears in a middle dekad of June next year, being a weather system affecting south China, and characteristics of position and intensity of the south trough line being critical indicating significance to weather analysis and forecasting, and the south trough results in cold and rainy weather in a large range of a southwest region in China, and different conditions including position, water vapor delivery, low altitude jets and cold air intensity dominates the precipitation intensity; and the south trough drifts eastwards to bring heavy precipitation to large regions including South China and East China; and
wherein obtaining the south trough in the geopotential height field refers to calculating the Laplacian numerical value of the geopotential height field H, searching for the gradient of the geopotential height field by calculating the gradient first, which is equivalent to acquiring the flowing direction of the water drops; and then searching for a low point of the geopotential height by calculating the divergence, which is equivalent to determining the converging position of the water drops, the nodes of the trough line; and a series of such nodes are connected in series to find the trough line.
|