| CPC H04L 41/0609 (2013.01) [H04L 41/0631 (2013.01); H04L 41/22 (2013.01); H04L 43/06 (2013.01); H04L 43/0817 (2013.01)] | 20 Claims |
|
1. A method for managing risk in a system, the method comprising:
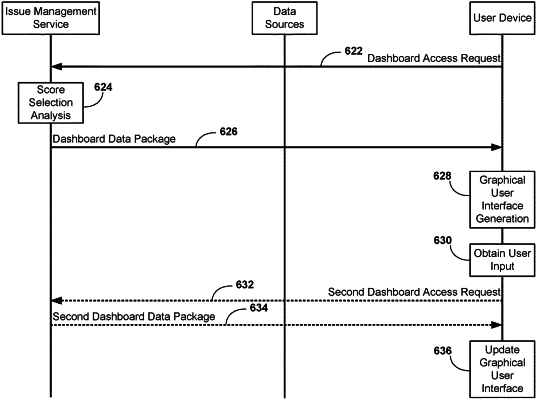
initiating, by dashboard management circuitry of a user device, a dashboard access request for a portion of open issues managed by an issue management system, each open issue being associated with a plurality of variables tracked by the issue management system;
obtaining, by the dashboard management circuitry and from the issue management system responsive to the dashboard access request, a dashboard data package based on severity scores for the portion of open issues, the severity scores indicating a severity level of the open issues of the portion of open issues, wherein a respective severity score for a respective open issue is generated based on a portion of a respective plurality of variables having been assigned non-zero weights in response to the portion of the respective plurality of variables being identified as being correlated to a respective issue outcome for the respective open issue;
generating, by graphical user interface management circuitry of the user device, a graphical user interface based on the dashboard data package, the graphical user interface comprising at least one area of a group of areas consisting of a severity visualization area, a severity change visualization area, and a severity trend visualization area;
presenting, by display hardware of the user device, the graphical user interface to a user;
obtaining, by input hardware of the user device, input from the user based on the presented graphical user interface; and
performing, by the dashboard management circuitry, an action set based on the input to manage the risk in the system.
|