| CPC G01N 21/6452 (2013.01) [G01N 21/272 (2013.01); G01N 21/77 (2013.01); G01N 33/579 (2013.01); G16H 10/40 (2018.01); G16H 15/00 (2018.01); G16H 20/17 (2018.01); G16H 40/63 (2018.01); G01N 2201/122 (2013.01)] | 25 Claims |

|
1. A computer-implemented method to generate visualizations of endotoxin concentrations in a fluid sample, the method comprising:
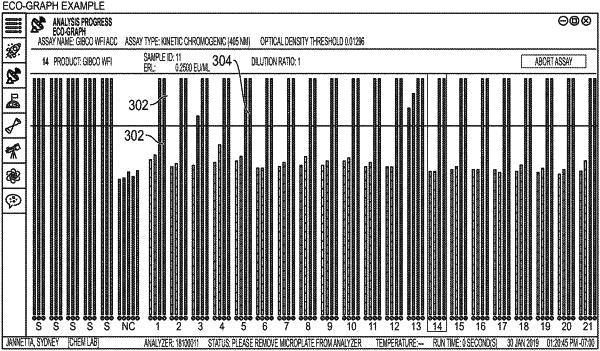
generating, by a processor, for a graphical user interface or for a report, to be displayed on a stationary or mobile computing device, a graphical visualization, from a data set that identifies an optical density (OD) reading of a microplate comprising a plurality of optical wells, each optical well containing a fluid sample, said graphical visualization comprising a vertically-oriented bar graph having a plurality of vertical bars with at least one vertically-oriented bar graph for each optical well of the microplate,
wherein the processor causes the vertically-oriented bar graph corresponding to the optical well of the microplate to increase vertically over time as a reaction between Limulus Amoebocyte Lysate (LAL) and bacterial endotoxin takes place in the optical well of the microplate,
wherein a greater amount of endotoxin present in the optical well, the faster the reaction occurs with the LAL reagent, and subsequently the faster the processor causes the associated vertically-oriented bar graph to increase on the graphical visualization.
|