| CPC H04L 43/16 (2013.01) [G06F 16/24578 (2019.01); G06F 16/282 (2019.01); G06F 16/904 (2019.01); H04L 41/065 (2013.01); H04L 41/0677 (2013.01); H04L 41/22 (2013.01); H04L 43/0817 (2013.01); H04L 67/02 (2013.01)] | 20 Claims |

|
1. A computer-implemented method comprising:
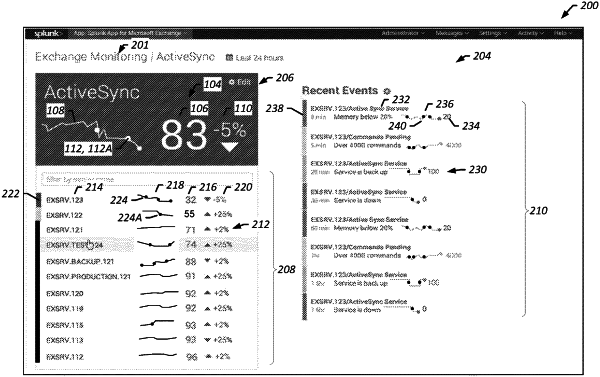
visually rendering a service-level dashboard reflecting performance of a service, wherein the service comprises a plurality of component services within an information technology environment, and wherein the service-level dashboard presents a visual indication of health of each of the plurality of component services, and a list of events each corresponding to a change in performance of one of the plurality of the component services; and
responsive to receiving, via a graphical user interface (GUI), a selection of a component service of the plurality of component services within the information technology environment:
visually rendering a system-level dashboard reflecting performance of the selected component service,
wherein the selected component service is performed by one or more machines, and the system-level dashboard presents the selected component service, the one or more machines that perform the selected component service, and one or more events corresponding to a selected machine of the one or more machines that perform the selected component service, wherein at least one event is generated for display based on a determination that the at least one event corresponds to a change of a metric score associated with the selected machine exceeding a threshold value for a metric resulting in a transition from a first performance state of the metric to a second performance state of the metric, wherein the at least one event comprises a discrete portion of text machine data describing a corresponding event and associated with a timestamp from the selected machine of the one or more machines.
|