| CPC F01D 21/003 (2013.01) [G05B 23/0221 (2013.01); F05D 2220/32 (2013.01)] | 13 Claims |

|
1. A method for calculating with a processor a load skewness result for a determination of service intervals for a turbine, based on historical and continuously measured sensor data of turbine operation, the method comprising:
equipping the gas turbine with a plurality of sensors;
receiving from a respective sensor of the plurality of sensors a continuously measured load signal over time, the load signal indicative of a load of the turbine during operation of the turbine;
storing the continuously measured load signal in a memory;
accessing with the processor the memory to determine a load percentage signal over time as a deviation of the received measured load signal with respect to a maximum capacity signal, wherein the maximum capacity signal represents a maximal possible load to be generated at a given time and is calculated from continuously measured sensor signals from further respective sensors of the plurality of sensors, the continuously measured sensor signals representing operating parameters of turbine operation;
calculating with the processor a load percentage distribution based on the determined load percentage signal;
calculating with the processor a load skewness factor as a measure of an asymmetry of the calculated load percentage distribution; and
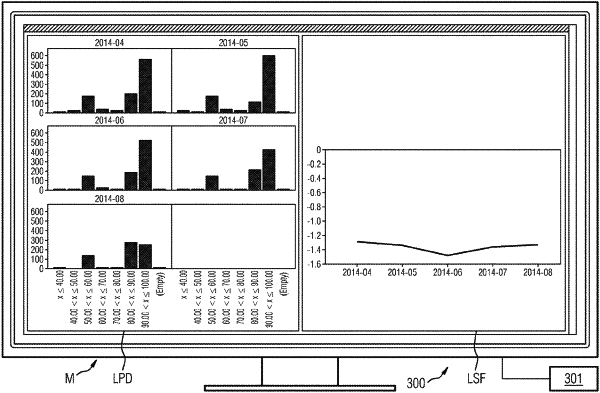
generating a graphical representation indicative of the load skewness result, the graphical representation supplied to a graphical user interface to simultaneously display the calculated load percentage distribution over time and the calculated load skewness factor over time.
|