| CPC G06Q 10/06393 (2013.01) [G06F 9/451 (2018.02); G06F 16/2465 (2019.01); G06F 40/186 (2020.01); G06Q 10/10 (2013.01); G06F 2216/03 (2013.01)] | 18 Claims |

|
1. A computer-implemented method for generation of graphical user interface dashboard templates, comprising:
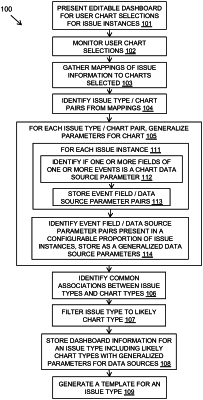
tracking, by one or more processors, user interactions with an editable graphic user interface dashboard when handling issue instances to gather one or more pre-generated chart selections, wherein a chart is a graphical visualization of one or more parameters of a data source, and wherein tracking user interactions with the editable graphic user interface dashboard comprises:
monitoring one or more chart selections, one or more chart deletions, and one or more data source configurations to a generated dashboard template instance implemented by a user using an editable dashboard tool when diagnosing an issue type; and
storing, based on the monitoring, a modified dashboard template instance implemented by the user when diagnosing the issue type;
training, by the one or more processors, a machine learning model to create mapping between the issue type and one or more chart visualization attributes of the modified dashboard template instance;
dynamically mapping, by the one or more processors, with the machine learning model, based on the gathered one or more pre-generated chart selections, common associations between the issue type and the one or more chart visualization attributes;
generating, by the one or more processors, generalized data source parameters for one or more data fields associated with the issue type to enable an automatic selection of one or more of the generated generalized data source parameters for future issues of the same issue type;
automatically generating, by the one or more processors, a new graphical user interface dashboard template for a future instance of the issue type based, at least in part, on the generated generalized data source parameters and the generated association rules between the issue type to chart pairs; and
updating, by the one or more processors, the machine learning model, based, at least in part, on gathered information from monitoring user interactions with the new graphical user interface dashboard template.
|