| CPC G06F 16/9024 (2019.01) [G06F 16/904 (2019.01); G06Q 50/28 (2013.01); G06T 11/206 (2013.01)] | 24 Claims |

|
1. A computer-implemented method for network visualization of data, the method comprising:
(a) creating, by a processor, a graph data model of the data, wherein the data is from a data source that is a single table structure;
(b) creating, by the processor, one or more groups based on one or more qualitative data mappings;
(c) creating, by the processor, one or more statistical summaries based on one or more quantitative data mappings;
(d) computing, by the processor, visual representations of the one or more quantitative mappings and the one or more qualitative mappings;
(e) establishing, by the processor, a plurality of node positions based on relationships between nodes and level constraints, the plurality of node positions appended to the graph data model;
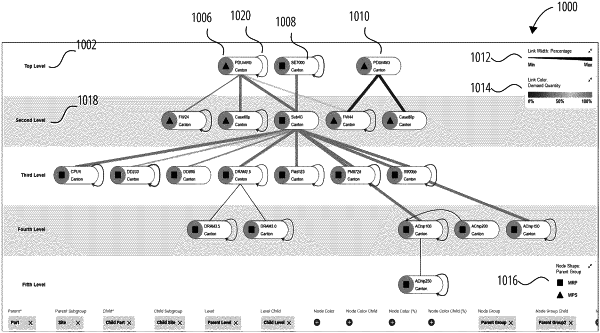
(f) rendering, by the processor, a graph visualization of the data;
(g) listening, by the processor, for events, in which the network visualization is manipulated by a user via a user interface; and
(h) in response to alteration of the data by the user via the user interface, repeating steps (a) through (g).
|