| CPC H04L 41/12 (2013.01) [H04L 41/22 (2013.01); H04L 41/5009 (2013.01); H04W 24/04 (2013.01); H04W 24/08 (2013.01)] | 20 Claims |
|
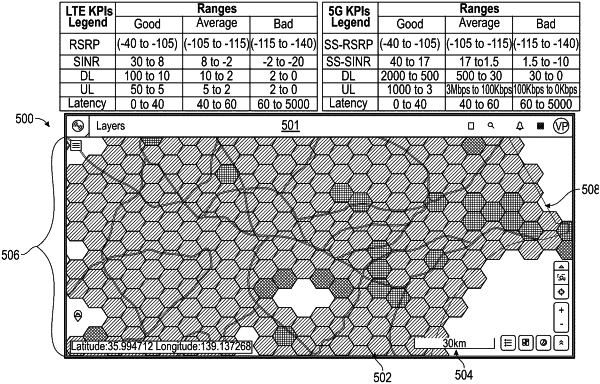
1. A method of network visualization, the method comprising:
receiving key performance indicator (KPI) data inputs collected for nodes included in a Radio Access Network (RAN);
filtering the KPI data to remove unreliable KPI data inputs;
determining whether the KPI data inputs for a predetermined geographic area exceeds a threshold sample count;
causing a graphical user interface (GUI) to be output by a user interface (UI), the GUI comprising:
a display of a shape, corresponding to the predetermined geographic area, layered over a map, where the shape represents an indication of network coverage quality, based on the filtered KPI data inputs, for a location corresponding to the shape corresponding to the predetermined geographic area.
|