| CPC G06F 3/0486 (2013.01) [G06F 3/0482 (2013.01); G06F 3/04817 (2013.01); G06F 16/26 (2019.01); G06T 11/206 (2013.01); G06T 11/60 (2013.01)] | 20 Claims |

|
1. A method for using visual analytic objects, comprising:
at an electronic device that that includes a display, one or more processors, and memory:
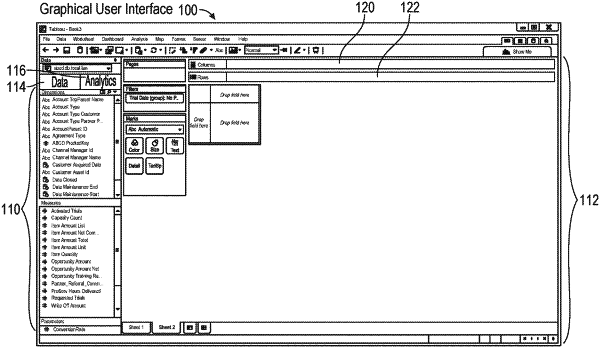
displaying a chart including visual marks representing a set of data, wherein the chart is displayed in accordance with contents of a plurality of displayed shelf regions and each shelf region determines a respective characteristic of the visual marks;
generating a visual analytic object by applying a first analytic operation to the set of data, and displaying the visual analytic object superimposed over the chart;
detecting user input to select the displayed visual analytic object and place an icon representing the visual analytic object onto a first shelf region of the plurality of shelf regions, the first shelf region defining a first characteristic of the visual marks; and
in response to the user input:
updating content of the first shelf region to include an association with the first analytic operation; and
updating the first characteristic of the visual marks in the chart based on values of the set of data represented by the visual marks relative to values computed by the first analytic operation.
|