| CPC A61B 5/742 (2013.01) [A61B 5/14532 (2013.01); A61B 5/725 (2013.01); A61B 5/7225 (2013.01); A61B 5/746 (2013.01)] | 21 Claims |

|
1. An analyte monitoring system comprising:
an analyte sensor configured to generate sensor measurements, wherein the sensor measurements include one or more light measurements and one or more temperature measurements, and at least the one or more light measurements are indicative of an amount or concentration of an analyte in a medium;
a transceiver configured to receive the sensor measurements via a wireless or wired connection and use at least the sensor measurements to calculate a first raw value corresponding to a first time, wherein the first raw value is an analyte level; and
a display device comprising:
a transceiver interface device configured to receive wirelessly the first raw value corresponding to the first time;
a user interface; and
a computer including a non-transitory memory and a processor, wherein the computer is configured to:
use the user interface to display a graph including at least the first raw value at the first time;
use a first smoothing algorithm and raw values including the first raw value to calculate a first smoothed value corresponding to the first time, wherein the first smoothing algorithm fits the raw values to a first polynomial;
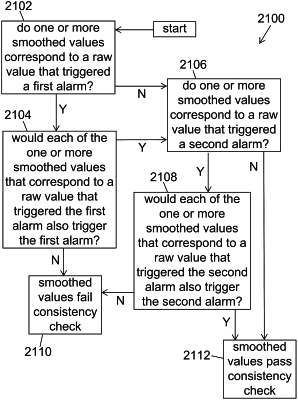
determine whether the first raw value triggered a first alarm for the first raw value being above a first threshold value;
determine whether the first raw value triggered a second alarm for the first raw value being below a second threshold value;
if the first raw value was determined to have triggered the first alarm, determine whether the first smoothed value is not above the first threshold value;
if the first raw value was determined to have triggered the second alarm, determine whether the first smoothed value is not below the second threshold value;
if the first raw value was determined to have triggered the first alarm and the first smoothed value was determined to be not above the first threshold value, recalculate the first smoothed value to be above the first threshold value, wherein a second smoothing algorithm is used to recalculate the first smoothed value, the second smoothing algorithm fits the raw values to a second polynomial, and the second smoothing algorithm is different than the first smoothing algorithm;
if the first raw value was determined to have triggered the second alarm and the first smoothed value was determined to be not below the second threshold value, recalculate the first smoothed value to be below the second threshold value, wherein the second smoothing algorithm is used to recalculate the first smoothed value; and
after displaying the graph including at least the first raw value at the first time, calculating the first smoothed value, and recalculating the first smoothed value if the first raw value was determined to have triggered the first alarm and the first smoothed value was determined to be not above the first threshold value or if the first raw value was determined to have triggered the second alarm and the first smoothed value was determined to be not below the second threshold value, update the graph by replacing the first raw value with the first smoothed value at the first time if the first smoothed value has not been recalculated or by replacing the first raw value with the recalculated first smoothed value if the first smoothed value has been recalculated.
|