| CPC G06T 3/4007 (2013.01) [G06T 7/90 (2017.01); G06T 2207/10024 (2013.01)] | 10 Claims |

|
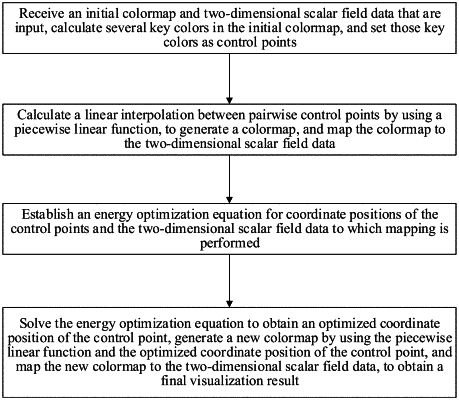
1. A two-dimensional scalar field data visualization method based on colormap optimization, comprising:
receiving an initial colormap and two-dimensional scalar field data that are input;
calculating key colors in the initial colormap, and setting those key colors as control points;
calculating a linear interpolation between pairwise control points by using a piecewise linear function, to generate a colormap, and mapping the colormap to the two-dimensional scalar field data;
establishing an energy optimization equation for coordinate positions of the control points and the two-dimensional scalar field data for which mapping is performed, wherein the coordinate positions of the control points are numerical values between 0 and 1 obtained by normalizing index values in the colormap corresponding to the control points; and
solving the energy optimization equation to obtain an optimized coordinate position of the control point, generating a new colormap by using the piecewise linear function and the optimized coordinate position of the control point, and mapping the new colormap to the two-dimensional scalar field data, to obtain a final visualization result.
|