| CPC H04L 41/14 (2013.01) [G06F 16/9024 (2019.01); H04L 41/12 (2013.01)] | 28 Claims |

|
1. A computer-implemented method of determining a historical state of a system, the method comprising:
obtaining data about the system from a plurality of different data sources over a period of time;
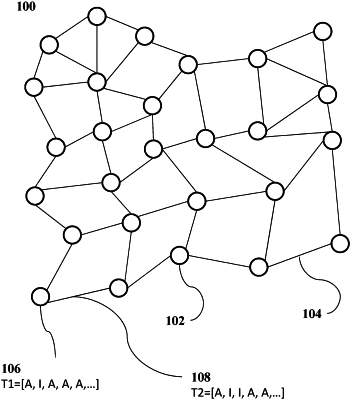
constructing, by a network graphing component, a full history dynamic network (FHDN) using the data, wherein the FHDN comprises a graph representing the system over the period of time, wherein the graph comprises:
(1) a plurality of nodes that represent elements of the system during the period of time, wherein the plurality of nodes are capable of dynamically changing over the period of time;
(2) a plurality of edges connecting the nodes, wherein each edge of the plurality of edges represents a relationship between a pair of nodes over the period of time, and wherein the plurality of edges are capable of dynamically changing over the period of time;
(3) first time series associated with each of the plurality of nodes; and
(4) second time series data associated with each of the plurality of edges,
wherein the first time series indicate changes in state of the plurality of nodes over the period of time and the second time series data indicate changes in the state of the plurality of edges over the period of time; and
generating a graphical representation of an operational state of the system at a historical time instance within the period of time in response to a query of the first time series and the second time series data of the FHDN.
|