| CPC G06Q 40/00 (2013.01) [G06Q 10/06393 (2013.01); G06T 11/20 (2013.01); G06T 11/206 (2013.01); G06T 15/20 (2013.01)] | 14 Claims |

|
1. A computer-implemented method for constructing a multivariate presentation of variables concerning a rating of a company, each variable having a unique set of underlying indicators, comprising:
computing, within at least one processor of an at least one computer in a distributed computer network, a numeric grade for each variable of the variables calculated on a scale that starts at zero by applying a formula that weighs a first value assigned to each indicator of the underlying indicators associated with each variable;
computing, within the at least one processor of the at least one computer, an overall numeric grade from the numeric grade computed for each variable, wherein the overall numeric grade represents an overall rating of the company based on the numeric grade computed for each variable;
defining, on a display screen of the at least one computer an origin;
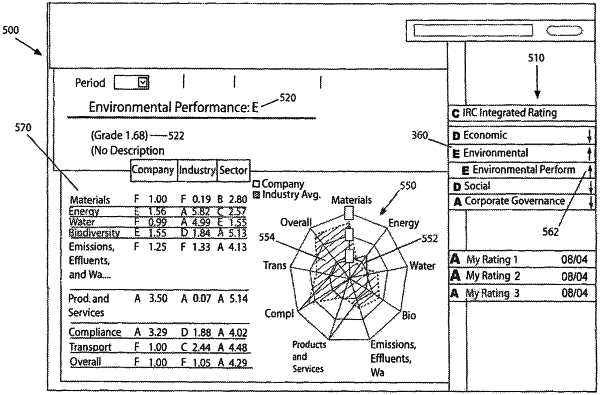
extending, from the origin, a first plurality of axes on the display screen, wherein the first plurality of axes comprising at least a first axis, a second axis, and a third axis, the first plurality of axes being generally equidistant from each other, a first axis of the first plurality of axes representing the overall numeric grade and second and third axes of the first plurality of axes representing a respective one of each of the variables;
plotting, on the display screen, the numeric grade of each of the variables and the overall numeric grade as a first point on a respective axis corresponding to the variable, thereby displaying first plotted points;
using the first plotted points to interpolate first linear segments between the first plotted points on each of the axes of the first plurality of axes to form a first polygon representative of a performance of the company;
plotting, on the display screen, benchmarking information corresponding to each of the variables as a second point on each axis of the first plurality of axes, thereby displaying second plotted points, wherein the benchmarking information is obtained from a database; and
using the second plotted points to interpolate second linear segments between the second plotted points on each of the axes of the first plurality of axes to form a second polygon indicative of a comparison between the performance of the company and the benchmarking information.
|