| CPC G06N 5/04 (2013.01) [G06N 20/00 (2019.01)] | 30 Claims |

|
1. A computer-implemented method comprising:
(a) receiving a data set comprising a plurality of features and outcome information corresponding to a plurality of patients;
(b) applying a clustering algorithm to said outcome information corresponding to said plurality of patients to identify two or more clusters defined by a plurality of outcomes comprising at least one of disease survival, disease progression, treatment efficacy, or adverse event for a treatment, wherein said two or more clusters comprise a first multi-outcome cluster defined by a first combined set of outcomes and a second multi-outcome cluster defined by a second combined set of outcomes;
(c) generating a predictive model using a machine learning algorithm, wherein said predictive model is configured to determine associations between said plurality of features within said data set and said two or more clusters defined by said plurality of outcomes;
(d) evaluating an input data for a patient using said predictive model to generate an output comprising a determination of the first multi-outcome cluster or the second multi-outcome cluster selected from said two or more clusters, wherein said patient is predicted to have said first combined set of outcomes or said second combined set of outcomes based on said determination; and
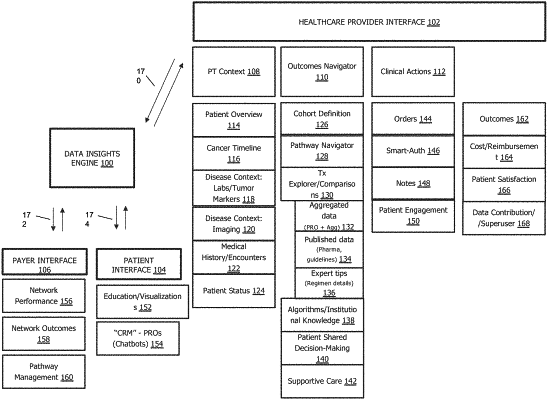
(e) providing a healthcare provider interface configured to present a visual representation of data from the first multi-outcome cluster or the second multi-outcome cluster determined for said patient, wherein said visual representation shows a cohort definition subgrouping comprising patients belonging to at least the first multi-outcome cluster or the second multi-outcome cluster.
|