| CPC G06F 16/904 (2019.01) [G06F 3/0483 (2013.01); G06F 3/04842 (2013.01); G06F 16/244 (2019.01); G06F 16/2445 (2019.01); G06F 16/287 (2019.01); G06F 16/9027 (2019.01)] | 19 Claims |

|
1. A method of visually analyzing row-level calculations for data visualizations, comprising:
at a computer having a display, one or more processors, and memory storing one or more programs configured for execution by the one or more processors:
receiving user selection of a data source;
displaying a data visualization in a data visualization user interface, wherein the data visualization comprises a plurality of visual data marks representing data from the data source;
detecting a first user input to select a subset of the visual data marks;
in response to detecting the first user input:
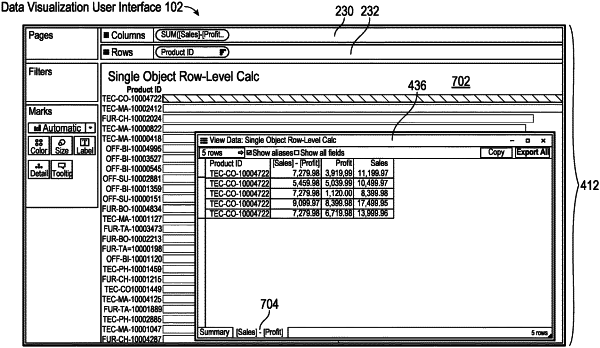
displaying a view data window including a summary of the selected subset of visual data marks in a summary tab of the view data window;
obtaining a data model encoding the data source as a tree of logical tables;
determining, based on the data model, a plurality of data fields used in a row-level calculation referenced in the selected subset of visual marks;
selecting, from one or more logical tables of the data model, (i) a plurality of rows of data that are used in the selected visual marks, (ii) a plurality of columns that correspond to the plurality of fields used in the row-level calculation, (iii) a column that corresponds to a dimension data field that is represented by the selected visual marks and (iv) a column that represents the row-level calculation; and
displaying, in the view data window distinct from the summary tab, information relevant to the row-level calculation, including:
(i) the plurality of rows of data used in the selected visual marks;
(ii) the plurality of columns that correspond to the plurality of fields used in the row-level calculation;
(iii) the column that corresponds to the dimension data field that is represented by the selected visual marks; and
(iv) the column that represents the row-level calculation;
without displaying additional columns from the one or more logical tables.
|