| CPC G06F 3/0482 (2013.01) [G06F 3/04842 (2013.01); G06F 3/04845 (2013.01); G06F 3/04847 (2013.01); G06F 3/04883 (2013.01); G06F 40/18 (2020.01); G06T 13/80 (2013.01); G06F 2203/04808 (2013.01)] | 20 Claims |

|
1. A method, comprising:
at an electronic device with a display, one or more processors, and memory:
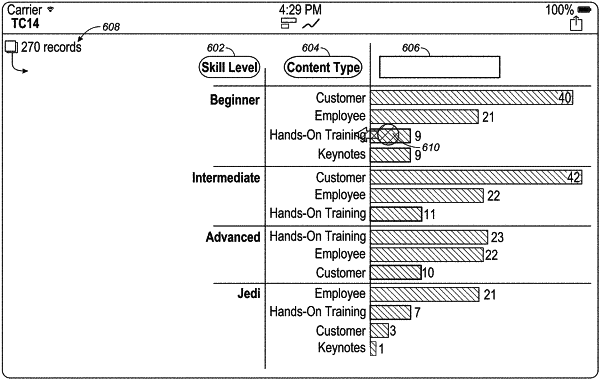
displaying a first chart representing data from a data set, the chart comprising (i) a first region displaying labels corresponding to data values of a first data field in the data set, (ii) a second region displaying labels corresponding to data values of a second data field in the data set, and (iii) a third region displaying a plurality of visual marks, each visual mark representing aggregated data corresponding to a respective pair of data values for the first data field and the second data field;
detecting a first user input at a first location;
determining whether the first location is in the first region, the second region, or the third region;
in response to the first user input, removing one or more of the visual marks from the first chart via an animated transition, wherein the one or more visual marks move in concert with movement of the first user input during at least a portion of the animated transition, including:
in accordance with a determination that the first location is in the first region and a determination that the first location corresponds to a label for a first data value for the first data field, removing all of the visual marks in the first chart that correspond to the first data value;
in accordance with a determination that the first location is in the second region and a determination that the first location corresponds to a label for a second data value for the second data field, removing all of the visual marks in the first chart that correspond to the second data value; and
in accordance with a determination that the location is in the third region and a determination that the location corresponds to a first visual mark, removing only the first visual mark from the first chart; and
updating display of the first chart in accordance with removing the one or more visual marks.
|