| CPC G06N 20/00 (2019.01) [G06F 3/0481 (2013.01); G06F 3/0486 (2013.01); G06F 16/2272 (2019.01); G06F 16/248 (2019.01); G06F 16/252 (2019.01); G06F 16/26 (2019.01); G06T 11/206 (2013.01); G06T 2200/24 (2013.01)] | 11 Claims |

|
1. A system for use of machine learning in a data visualization environment, to automatically determine, for a set of data, one or more outliers or findings within the data set, comprising:
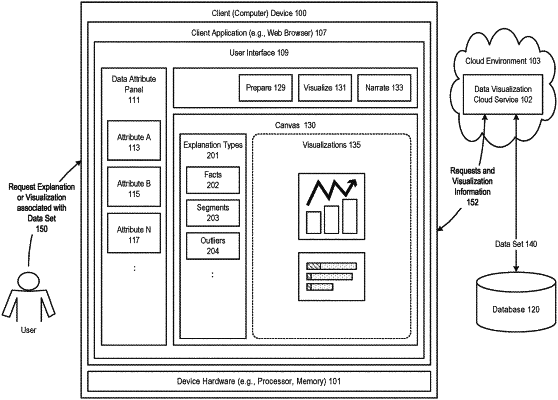
one or more computer systems or devices, including a microprocessor, and a data visualization service executing thereon that provides access to a database having a data set associated with a plurality of attributes and dimensions;
wherein the data visualization service provides access by a client system to communicate requests for information associated with the data set, and receive at a user interface, findings associated with the data set and displayed as visualizations within the user interface;
wherein the data visualization service is adapted to:
receive, from the client system, an indication of a target attribute of interest as provided within the data set;
determine a plurality of dimension attributes associated with the data set;
for each of one or more pairs of the dimension attributes, calculate, for a first dimension attribute, expected values of the target attribute with respect to values of the target attribute associated with a second dimension attribute;
determine observed values for the target attribute within the data set;
generate ranked findings associated with the data set based on a comparison of the expected values and observed values for the target attribute; and
report the ranked findings to the client system, for use in generating a data visualization for initial display at the user interface;
wherein, after reporting the ranked findings to the client system, the data visualization service automatically continues to evaluate pairs of dimension attributes to determine additional findings, and report the additional findings as the ranked findings to the client system for display at the user interface, the additional findings displayed replacing at least one of the ranked findings in the initial display.
|