| CPC G06F 16/9038 (2019.01) [G06F 3/04842 (2013.01); G06Q 30/0201 (2013.01)] | 20 Claims |
|
1. A computer-implemented method, comprising:
providing a graphical user interface for presentation of a report associated with a dataset, the graphical user interface comprising:
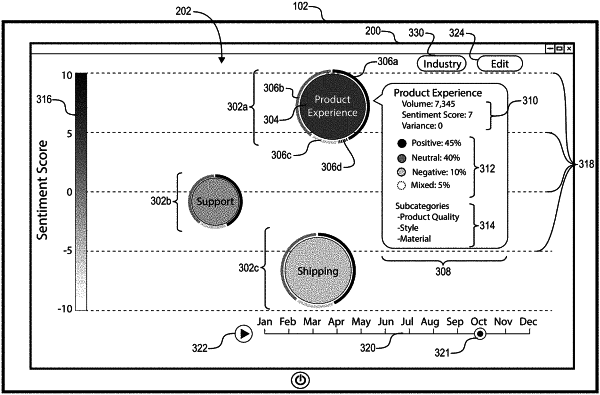
a multidata display element comprising a first active display element and a second active display element for visualizing a plurality of data characteristics of data related to a topic corresponding to a first time period within the dataset, the first active display element comprising a first visual attribute indicating a value corresponding to a first data characteristic of the data related to the topic and the second active display element comprising a second visual attribute indicating a value corresponding to a second data characteristic of the data related to the topic;
a data axis with values corresponding to the first data characteristic and the multidata display element at a position along the data axis according to the first data characteristic of the data for the first time period; and
a timeline activation button;
receiving a user interaction with the timeline activation button; and
based on receiving the user interaction with the timeline activation button, updating the multidata display element by modifying the first active display element and the second active display element based on data corresponding to a second time period within the dataset and updating the position of the multidata display element along the data axis according to the first data characteristic of the data for the second time period.
|