| CPC G06T 11/206 (2013.01) [G06F 3/0486 (2013.01); G06F 3/04847 (2013.01); G06F 16/2477 (2019.01); G06Q 10/06 (2013.01); G06Q 30/02 (2013.01); G06Q 30/0201 (2013.01); G06T 11/001 (2013.01)] | 18 Claims |

|
1. A computer-implemented method comprising:
causing display of a graphical user interface, the graphical user interface including a first element enabling input to specify a time range and a second element enabling input to specify a field;
upon receiving first input specifying the time range and second input specifying the field, identifying a plurality of events, wherein each event of the plurality events is associated with respective a timestamp that is within the time range;
determining, using values for the field included in the plurality of events, unique values;
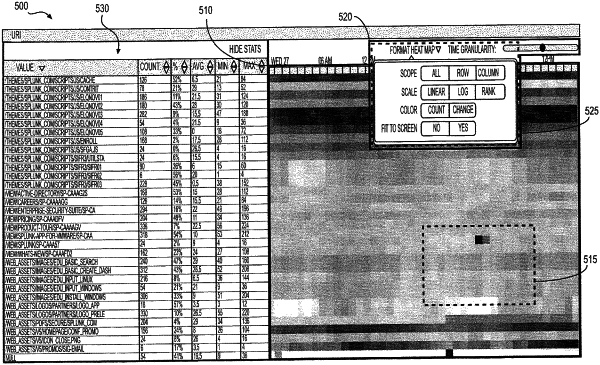
causing display, in the graphical user interface, of a visualization of the unique values, the visualization including a first set of rows for each unique value, wherein each row of the first set of rows is divided into regions each representing a timeslot within the time range, wherein each region in a particular row of the first set of rows graphically illustrates a count of events from the plurality of events that both have an associated timestamp that is within a respective timeslot represented by the region and include a particular unique value associated with the particular row;
causing display, in the graphical user interface, of a table including a second set of rows that each correspond to the first set of rows, wherein each row of the second set of rows includes a set of statistics determined from events from the plurality of events, and wherein the table and the visualization are concurrently displayed; and
based on a user input of hovering, scanning, or dragging on a specific area of the visualization, causing presentation of a dialog window that includes a hyperlink that, when selected, causes presentation of additional information related to the specific area of visualization.
|