| CPC G06Q 30/0202 (2013.01) [G06F 3/0482 (2013.01); G06Q 10/06315 (2013.01); G06Q 10/087 (2013.01)] | 20 Claims |

|
1. A method for visualizing projected inventory positions of items across stores of a supply chain network, the method comprising:
generating and providing a graphical user interface (GUI), as part of a visualization tool, to a computing device;
receiving a selection for an event-based manner of simulation;
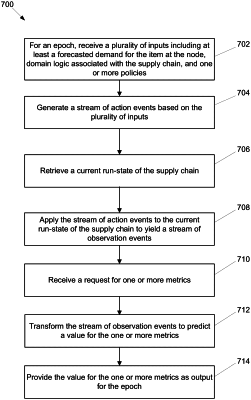
executing, by a simulation computing system in response to receiving the selection, a first simulation process that outputs a first stream of observation events in a first order, the first stream of observation events being ordered over a course of each epoch of a plurality of epochs, wherein the first stream of observation events are related to inventory and changes thereto for a plurality of items at a plurality of stores of the supply chain network over the plurality of epochs;
aggregating the first stream of observation events according to the first order to generate first simulation data including predicted values for metrics;
rendering on a display of the computing device of a plurality of computing devices, on the GUI as part of the visualization tool, a single consolidated graphical view including an item menu comprising the plurality of items for selection and a store menu comprising a network of stores for selection, the item menu and the store menu enabling a user to select a level of granularity for viewing the metrics;
receiving, at the computing device via the GUI, a selection of one or more items from the item menu and a selection of one or more stores from the store menu, the received selections corresponding to a first level of granularity;
retrieving, by the visualization tool, a portion of the predicted values for the metrics that correspond to the first level of granularity using an index to retrieve the portion of the predicted values;
for each metric, aggregating, by the visualization tool, the predicted values of the respective metric at the first level of granularity on a per epoch basis;
rendering on the display of the computing device, as part of the GUI, the single consolidated graphical view with a representation of a plurality of simulation data types including at least the portion of the aggregated metrics at the first level of granularity over at least the portion of the plurality of epochs, wherein the portion of the aggregated metrics includes an expected projection and a worst case projection for one or more metric types;
receiving a second selection for a per epoch-based manner of simulation;
executing, by the simulation computing system in response to receiving the second selection, a second simulation process that outputs a second stream of observation events in a second order different from the first order, the second stream of observation events being grouped and ordered by event type for simplified evaluation, wherein observed events in the first stream of observation events are different from observed events in the second stream of observation events based on changes to simulation logic across the supply chain network caused by differences in the first order and the second order;
aggregating the second stream of observation events according to the second order to generate second simulation data, wherein the first simulation data is different from the second simulation data; and
rendering on the display of the computing device, on the GUI as part of the visualization tool, the single consolidated graphical view with a second representation of the second simulation data, including a second subset of metrics for the selected one or more items at the selected one or more stores over the plurality of epochs at the first level of granularity.
|