| CPC H04L 41/22 (2013.01) [G06F 3/048 (2013.01); G06F 3/0481 (2013.01); G06T 11/206 (2013.01); G06T 2200/24 (2013.01)] | 14 Claims |

|
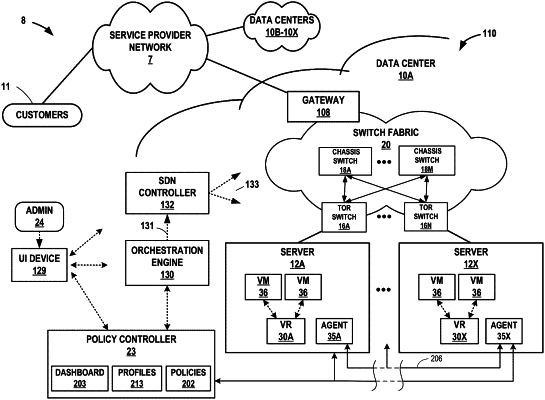
1. A computing system comprising processing circuitry having access to a memory device, the processing circuitry configured to:
obtain one of:
respective latencies between pairs of respective servers represented by a corresponding pair of aggregates of a plurality of aggregates, wherein each of the plurality of aggregates represents a plurality of servers, or
respective round-trip times between the pairs of respective servers represented by the corresponding pair of aggregates;
generate a graphical user interface comprising:
respective graphical elements for the plurality of aggregates, , and
respective graphical indicators visually linking pairs of graphical elements, each of the pairs of graphical elements corresponding to a different pair of the aggregates,
wherein each of the graphical indicators indicates a performance metric for communications between the corresponding pair of the aggregates, wherein the performance metric is one of:
minimum latency, maximum latency, or average latency of the respective latencies between pairs of respective servers represented by the corresponding pair of aggregates, or
minimum round-trip time, maximum round-trip time, or average round-trip time of the respective round-trip times between the pairs of respective servers represented by the corresponding pair of aggregates; and
output the graphical user interface for display at a display device.
|