| CPC G06F 16/2474 (2019.01) [G06F 16/248 (2019.01); G06F 16/9024 (2019.01); G16H 10/60 (2018.01)] | 20 Claims |

|
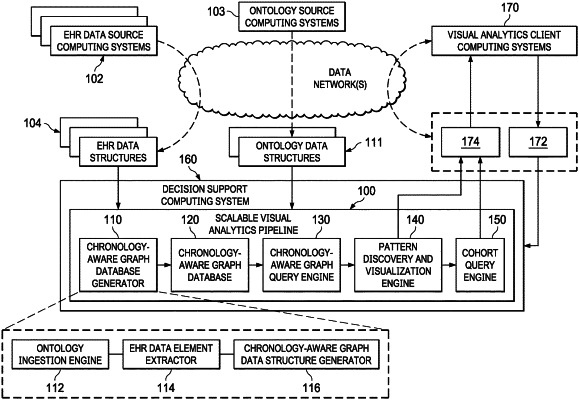
1. A method, in a data processing system comprising at least one processor and at least one memory, the at least one memory comprising instructions executed by the at least one processor to specifically configure the at least one processor to implement a visual analytics pipeline that performs the method comprising:
generating, by a chronology aware graph data structure generator of the visual analytics pipeline, from an input database of records, a chronology-aware graph data structure of a plurality of records based features specified in an ontology data structure, wherein the chronology-aware graph data structure comprises vertices representing one or more of events or records based features corresponding to events, and edges representing chronological relationships between events;
executing, by a chronology aware graph query engine of the visual analytics pipeline, a chronology-aware graph query on the chronology-aware graph data structure to generate a filtered set of vertices and corresponding features corresponding to criteria of the chronology-aware graph query;
executing, by a pattern discovery and visualization engine of the visual analytics pipeline, a pattern discovery operation on the filtered set of vertices and corresponding features to identify a subset of vertices and corresponding features that correspond to a relatively higher frequency set of patterns of event paths; and
generating, by the pattern discovery and visualization engine, a visual analytics graphical representation for the subset of vertices and corresponding features in a visual analytics output, wherein executing the pattern discovery operation on the filtered set of vertices and corresponding features comprises the pattern discovery and visualization engine:
generating a pattern graph data structure comprising nodes corresponding to the filtered set of vertices and edges connecting vertices, where each edge has a weight corresponding to a pattern frequency, wherein the pattern frequency specifies a frequency of a pattern comprising the connected vertices of the corresponding edge, occurring in the pattern graph data structure;
determining, for each path of the pattern graph data structure, a sum of weights of edges along the path to generate a summed pattern frequency along the path; and
processing the generated pattern graph data structure to select a predetermined number of paths of patterns of vertices in the pattern graph data structure having a relatively highest ranked summed pattern frequency information.
|