| CPC G06T 5/50 (2013.01) [G02B 21/367 (2013.01)] | 6 Claims |

|
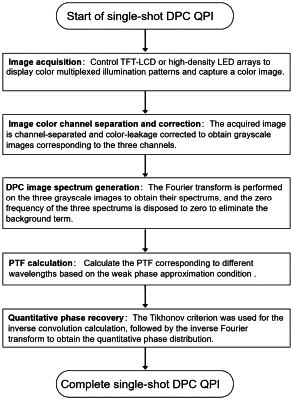
1. A single-shot differential phase contract (DPC) quantitative phase imaging (QPI) method based on color multiplexed illumination, comprising the steps of:
step 1, displaying color multiplexed illumination pattern irradiated samples by a computer-controlled high-contrast LCD TFT-LCD or high-density programmable LED array, while sending illumination control to generate a synchronous trigger signal to a color camera to acquire a color sample image, recorded as Ic;
step 2, separting the color sample image Ic in a single channel and performing a color leakage correction to obtain sample intensity images Ir,corr, Ig,corr, Ib,corr corresponding to red, green and blue three channels;
step 3, perfomring a fourier transform on the sample intensity images Ir,corr, Ig,corr, Ib,corr, to obtain spectral distribution of the sample intensity images, including setting azero frequency of three spectra is set to 0, to eliminate an effect of a background term, to obtain a DPC image spectral distribution of the sample intensity images, expressed as
 , ,  , ,  ; ;step 4, based on weak phase approximation condition, calculating phase transfer function (PTF) including PTFr(ρ,θ), PTFg(ρ,θ), PTFb(ρ,θ), corresponding to different wavelengths according to parameters of an illumination function and an objective lens;
step 5, according to the PTF including PTFr(ρ,θ), PTFg(ρ,θ), PTFb(ρ,θ), at different wavelengths and a DPC image spectral distribution
 , ,  , ,  of the sample intensity images, using a Tikhonov criterion for an inverse convolution calculation to obtain a high-resolution spectrum of a sample phase, and performing an inverse Fourier transform on the high-resolution spectrum to obtain a quantitative phase distribution ϕ of the sample by the following equation: of the sample intensity images, using a Tikhonov criterion for an inverse convolution calculation to obtain a high-resolution spectrum of a sample phase, and performing an inverse Fourier transform on the high-resolution spectrum to obtain a quantitative phase distribution ϕ of the sample by the following equation: where k denotes different wavelength channels, red, green, blue; PTF*k(ρ,θ) denotes a conjugate distribution of PTFk(ρ,θ); λk |λ denotes a wavelength normalization coefficient, λ denotes a normalized wavelength, β is a normalization parameter.
|