| CPC G06F 3/04847 (2013.01) [G06F 3/04842 (2013.01); G06F 16/248 (2019.01); G06F 16/2428 (2019.01); G06F 16/26 (2019.01); G06T 11/206 (2013.01); G06F 2203/04806 (2013.01)] | 12 Claims |
|
1. An apparatus comprising at least one processor and at least one non-transitory memory comprising a computer program code, the at least one non-transitory memory and the computer program code configured to, with the at least one processor, cause the apparatus to:
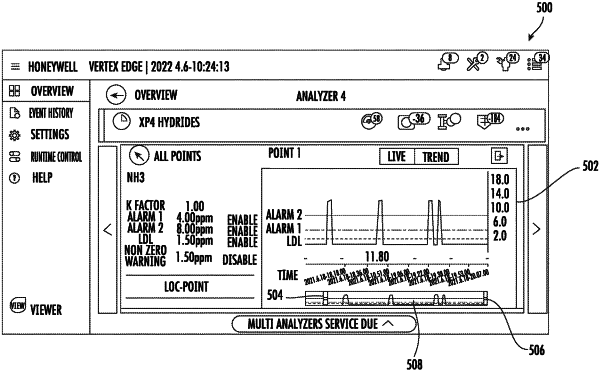
cause rendering of a gas concentration trend chart user interface on a display, wherein the gas concentration trend chart user interface comprises a gas concentration data point graphic section configured to display a first data set in an hourly mode, a left graphic slider user interface element, a right graphic slider user interface element, and a given time window between the left graphic slider user interface element and the right graphic slider user interface element, the given time window representative of a time of interest;
receive, via the gas concentration trend chart user interface, a first user interaction input causing a reduced graphic distance between the left graphic slider user interface element and the right graphic slider user interface element;
in response to receiving the first user interaction input, identify the reduced graphic distance on the gas concentration trend chart user interface;
determine that the reduced graphic distance satisfies a minute mode triggering distance threshold;
in response to determining that the reduced graphic distance satisfies the minute mode triggering distance threshold, cause the gas concentration data point graphic section to display a second data set in a minute mode, wherein displaying the second data set in the minute mode corresponds to displaying a data set that represents the first data set in a minute scale;
receive, via the gas concentration trend chart user interface, a second user interaction input that corresponds to each of movement of the left graphic slider user interface element to leftmost position of the given time window and movement of the right graphic slider user interface element to rightmost position of the given time window;
determine, based on the second user interaction input, that an increased graphic distance between the left graphic slider user interface element and the right graphic slider user interface element satisfies an hourly mode triggering distance threshold, wherein the hourly mode triggering distance threshold comprises a graphic distance between the left graphic slider user interface element at the leftmost position and the right graphic slider user interface element at the rightmost position; and
in response to determining that the increased graphic distance satisfies the hourly mode triggering distance threshold, cause the gas concentration data point graphic section to display the second data set in the hourly mode.
|