| CPC A61B 8/463 (2013.01) [A61B 8/06 (2013.01); A61B 8/145 (2013.01); A61B 8/465 (2013.01); A61B 8/469 (2013.01); A61B 8/5223 (2013.01); A61B 8/5246 (2013.01); A61B 8/488 (2013.01)] | 19 Claims |

|
1. An ultrasonic blood flow parameter displaying method, comprising:
obtaining an ultrasonic signal from a scan target through a probe;
obtaining blood flow velocity vectors in the scan target according to the ultrasonic signal;
obtaining an ultrasonic image of at least a portion of the scan target according to the ultrasonic signal;
displaying the ultrasonic image;
obtaining an indication of a sampling box on the ultrasonic image;
extracting multiple blood flow velocity directions from the blood flow velocity vectors associated with the sampling box;
calculating a variance or a standard deviation of the extracted multiple blood flow velocity directions;
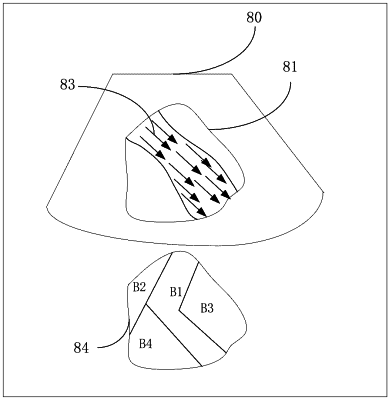
segmenting an area of the ultrasonic image associated with the sampling box into a plurality of non-overlapping regions according to the variance or the standard deviation for each region;
constructing an icon model comprising a plurality of blocks respectively corresponding to the plurality of non-overlapping regions, wherein each block indicates the variance or the standard deviation of the extracted multiple blood flow velocity directions for the respective region; and
comparatively displaying the icon model simultaneously with the ultrasonic image.
|