| CPC G06T 11/206 (2013.01) [G01W 1/10 (2013.01); G06F 16/26 (2019.01); G06Q 10/04 (2013.01); G06Q 50/26 (2013.01)] | 8 Claims |

|
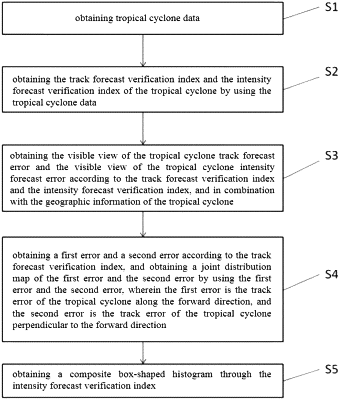
1. A visualization analysis method of tropical cyclone forecast verification index data, characterized by comprising the following steps:
acquiring, tropical cyclone data;
determining, a track forecast verification index and an intensity forecast verification index of the tropical cyclone, based on the tropical cyclone data;
drawing, a diagram of a tropical cyclone track forecast error and a diagram of a tropical cyclone intensity forecast error, based on the track forecast verification index and the intensity forecast verification index, and in combination with the geographic information of the tropical cyclone;
determining, a first error and a second error, according to the track forecast verification index, and drawing, a joint distribution map of the first error and the second error, by using the first error and the second error; wherein
the first error is a track error of the tropical cyclone along a forward direction, and the second error is a track error of the tropical cyclone perpendicular to the forward direction; and
drawing, a composite box-shaped histogram, based on the intensity forecast verification index;
wherein the determining the track forecast verification index and the intensity forecast verification index based on the tropical cyclone data comprises:
obtaining, an initial position, a forecasted position, a forecasted intensity, an actual position and an actual intensity of the tropical cyclone, by using the tropical cyclone data, wherein the actual position and actual intensity are the actual position and actual intensity of the forecasted position at a corresponding forecast time; and
determining, the track forecast verification index and the intensity forecast verification index, according to the initial position, the forecasted position, the actual position and the actual intensity, respectively;
wherein, the determining the first error and the second error according to the track forecast verification index, and drawing the joint distribution map of the first error and the second error by using the first error and the second error, wherein the first error is the track error of the tropical cyclone along the forward direction, and the second error is the track error of the tropical cyclone perpendicular to the forward direction, comprises:
determining, the first error and the second error, based on the initial position, the forecasted position, and the actual position of the track forecast verification index;
defining, a drawing standard for drawing the joint distribution map;
drawing, a joint scatter distribution map of the first error and the second error, by using data distribution of the first error and the second error;
performing, bivariate kernel density estimation, on values of the first error and the second error, to obtain bivariate kernel density estimation values and to draw a bivariate kernel density estimation graph of the first error and the second error based on the bivariate kernel density estimation values;
drawing, a first histogram and a second histogram, by using the first error and the second error, respectively;
inserting, the first histogram and the second histogram, into the bivariate kernel density estimation graph, thereby obtaining an overall distribution map of the first error and the second error; and
superimposing, a plurality of joint scatter distribution maps of tropical cyclone samples, in the overall distribution map, to obtain the joint distribution map.
|